


5- Analysis
Structure Segmentation
Overview
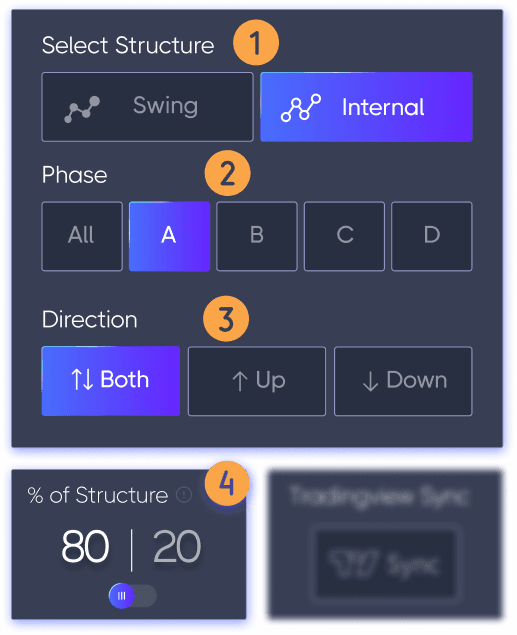
The Structure Selection component allows traders to filter and segment their mapped market structure, providing a focused view of structural behavior. Traders can refine their analysis by selecting structure type, phase, direction, and statistical significance using the 80/20 filter.
Key Features
Structure Type Selection
Choose between Swing Structure and Internal Structure to isolate major or minor market movements.
Phase Selection
View all structural phases or focus on a specific phase (A, B, C, D) within the selected structure type.
Directional Filtering
Options to display All, Up Only, or Down Only structures, allowing traders to analyze trends more effectively.
80/20 Statistical Filter
80% (Most Common Structures) – Focuses on the most statistically significant and frequently occurring structural patterns.
20% (Outliers) – Highlights less frequent, high-variance structures, which may indicate unusual market conditions or potential turning points.
The 80/20 Filter: Practical Insights
Identifying High-Probability Setups
Differentiates between reliable, repeating market behaviors (80%) and less predictable anomalies (20%).
Helps traders focus on setups with historical consistency, reducing exposure to low-probability trades.
Avoids unnecessary risk by filtering out unpredictable “black swan” events.
Pattern Recognition and Strategy Refinement
Reveals which structural patterns occur frequently, providing a statistical foundation for strategy development.
Highlights deviations from the norm, signaling when market conditions may be shifting.
Encourages data-driven trading, reducing reliance on subjective interpretation or emotional bias.
Why This Matters
The 80/20 filter applies the Pareto Principle to trading—suggesting that 80% of reliable trade opportunities come from 20% of market behaviors. This allows traders to:
Trade with clarity, focusing on repeatable structures rather than reacting to market noise.
Recognize changes in market conditions, as deviations from common patterns may indicate increased volatility or trend shifts.
Build consistency, by aligning trade decisions with historical market tendencies rather than assumptions.
Think of it like traffic patterns—most traders plan their commutes around predictable rush hour flow (80%), rather than random accidents or detours (20%). The same logic applies to trading market structure, ensuring traders focus on what statistically matters most.

