


3- The Mechanical Framework
Liquidity Interactions
The Crucial Relationship Between Liquidity and Market Structure
Market structure and liquidity are deeply interconnected, driving price action and creating opportunities for traders. While market structure provides the framework for price behavior, liquidity acts as the fuel that powers movement, influencing trends, reversals, and the flow of price action.
Structure Lab bridges these concepts by helping traders quantify liquidity and its impact on market structure, delivering actionable insights. This data-driven approach benefits traders in several key areas:
Identifying High-Value Liquidity Zones: Spotting areas where liquidity accumulates, such as swing highs, swing lows, and critical levels.
Understanding Phase-Liquidity Dynamics: Determining which phases of market structure are more likely to interact with liquidity or end with liquidity-driven events.
Improving Trade Confidence: Providing probabilities and patterns that support objective decision-making in high-probability scenarios.
By combining market structure and liquidity analysis, Structure Lab equips traders to make more informed, confident decisions.
1. Market Structure: The Skeleton of Price Action
Market structure forms the framework of price behavior, providing a visual roadmap for where price has been and potential turning points. It highlights:
Swing Highs and Lows: Key reference points for trend direction and potential reversals.
Trend Direction: The overall flow of price (uptrend, downtrend, or range).
Support and Resistance Levels: Zones where price has historically reacted or reversed.
However, while market structure shows where price might go, it doesn’t explain why price moves between these levels.
2. Liquidity: The Muscles Moving the Skeleton
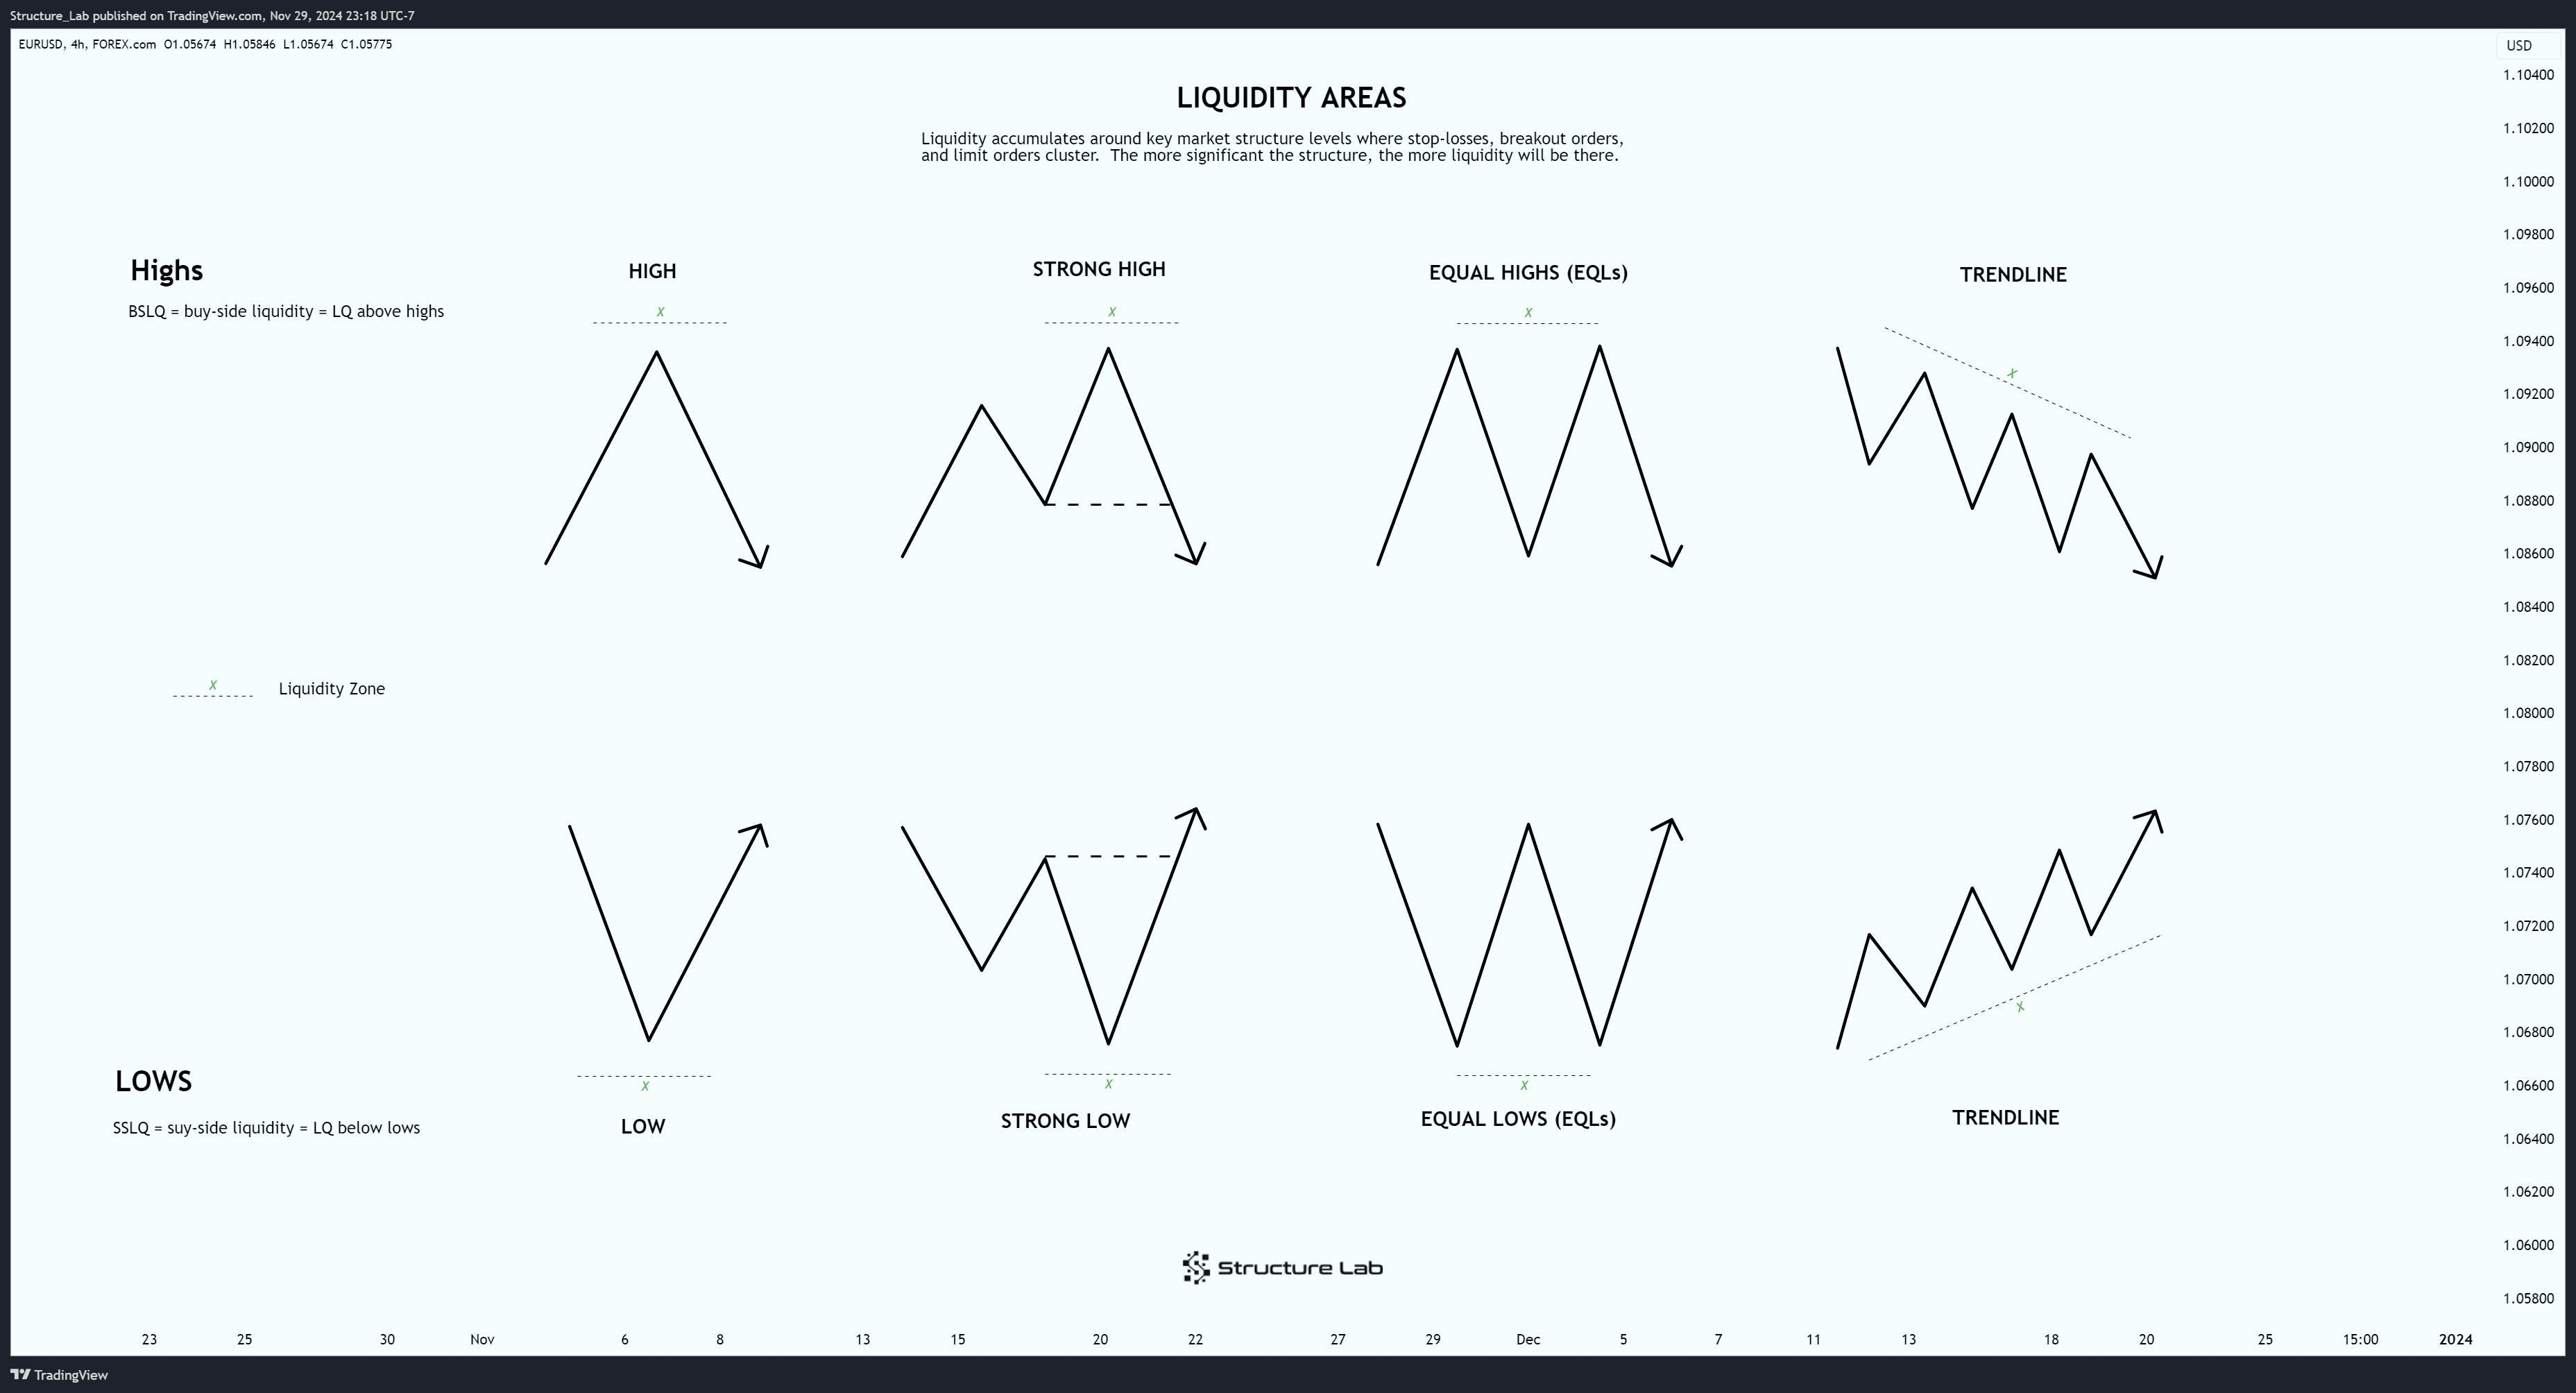
Liquidity accumulates at predictable points created by market structure, acting as the fuel for price movement:
Above Swing Highs:
Stop Losses: From traders holding short positions.
Buy Orders: For breakout traders looking to capitalize on upward momentum.
Below Swing Lows:
Stop Losses: From traders holding long positions.
Sell Orders: For breakout traders expecting price to drop further.
At Major Support/Resistance Levels:
Clusters of limit orders as traders anticipate reversals.
These pools of liquidity are attractive targets for the market, often influencing price to move toward them to facilitate order execution for large players like institutions.
https://s3.tradingview.com/snapshots/6/6VfImFLc.png
3. Liquidity and Market Structure Phases
Liquidity often interacts with market structure at specific phases, acting as a catalyst for significant price moves:
Liquidity Around Highs and Lows:
Liquidity frequently rests around swing highs and lows formed by market structure.
These areas become targets for price sweeps before reversals or trend continuations.
Structure Lab's Role:
Structure Lab analyzes which phases of market structure are more likely to interact with liquidity.
It also quantifies how often certain phases of structure begin or end with liquidity events.
This provides traders with actionable insights into the likelihood of liquidity-driven moves in specific structural contexts.
For example, if price enters a phase characterized by pro-swing and counter-internal movement, Structure Lab might highlight the increased probability of a liquidity sweep at swing highs before a continuation move.
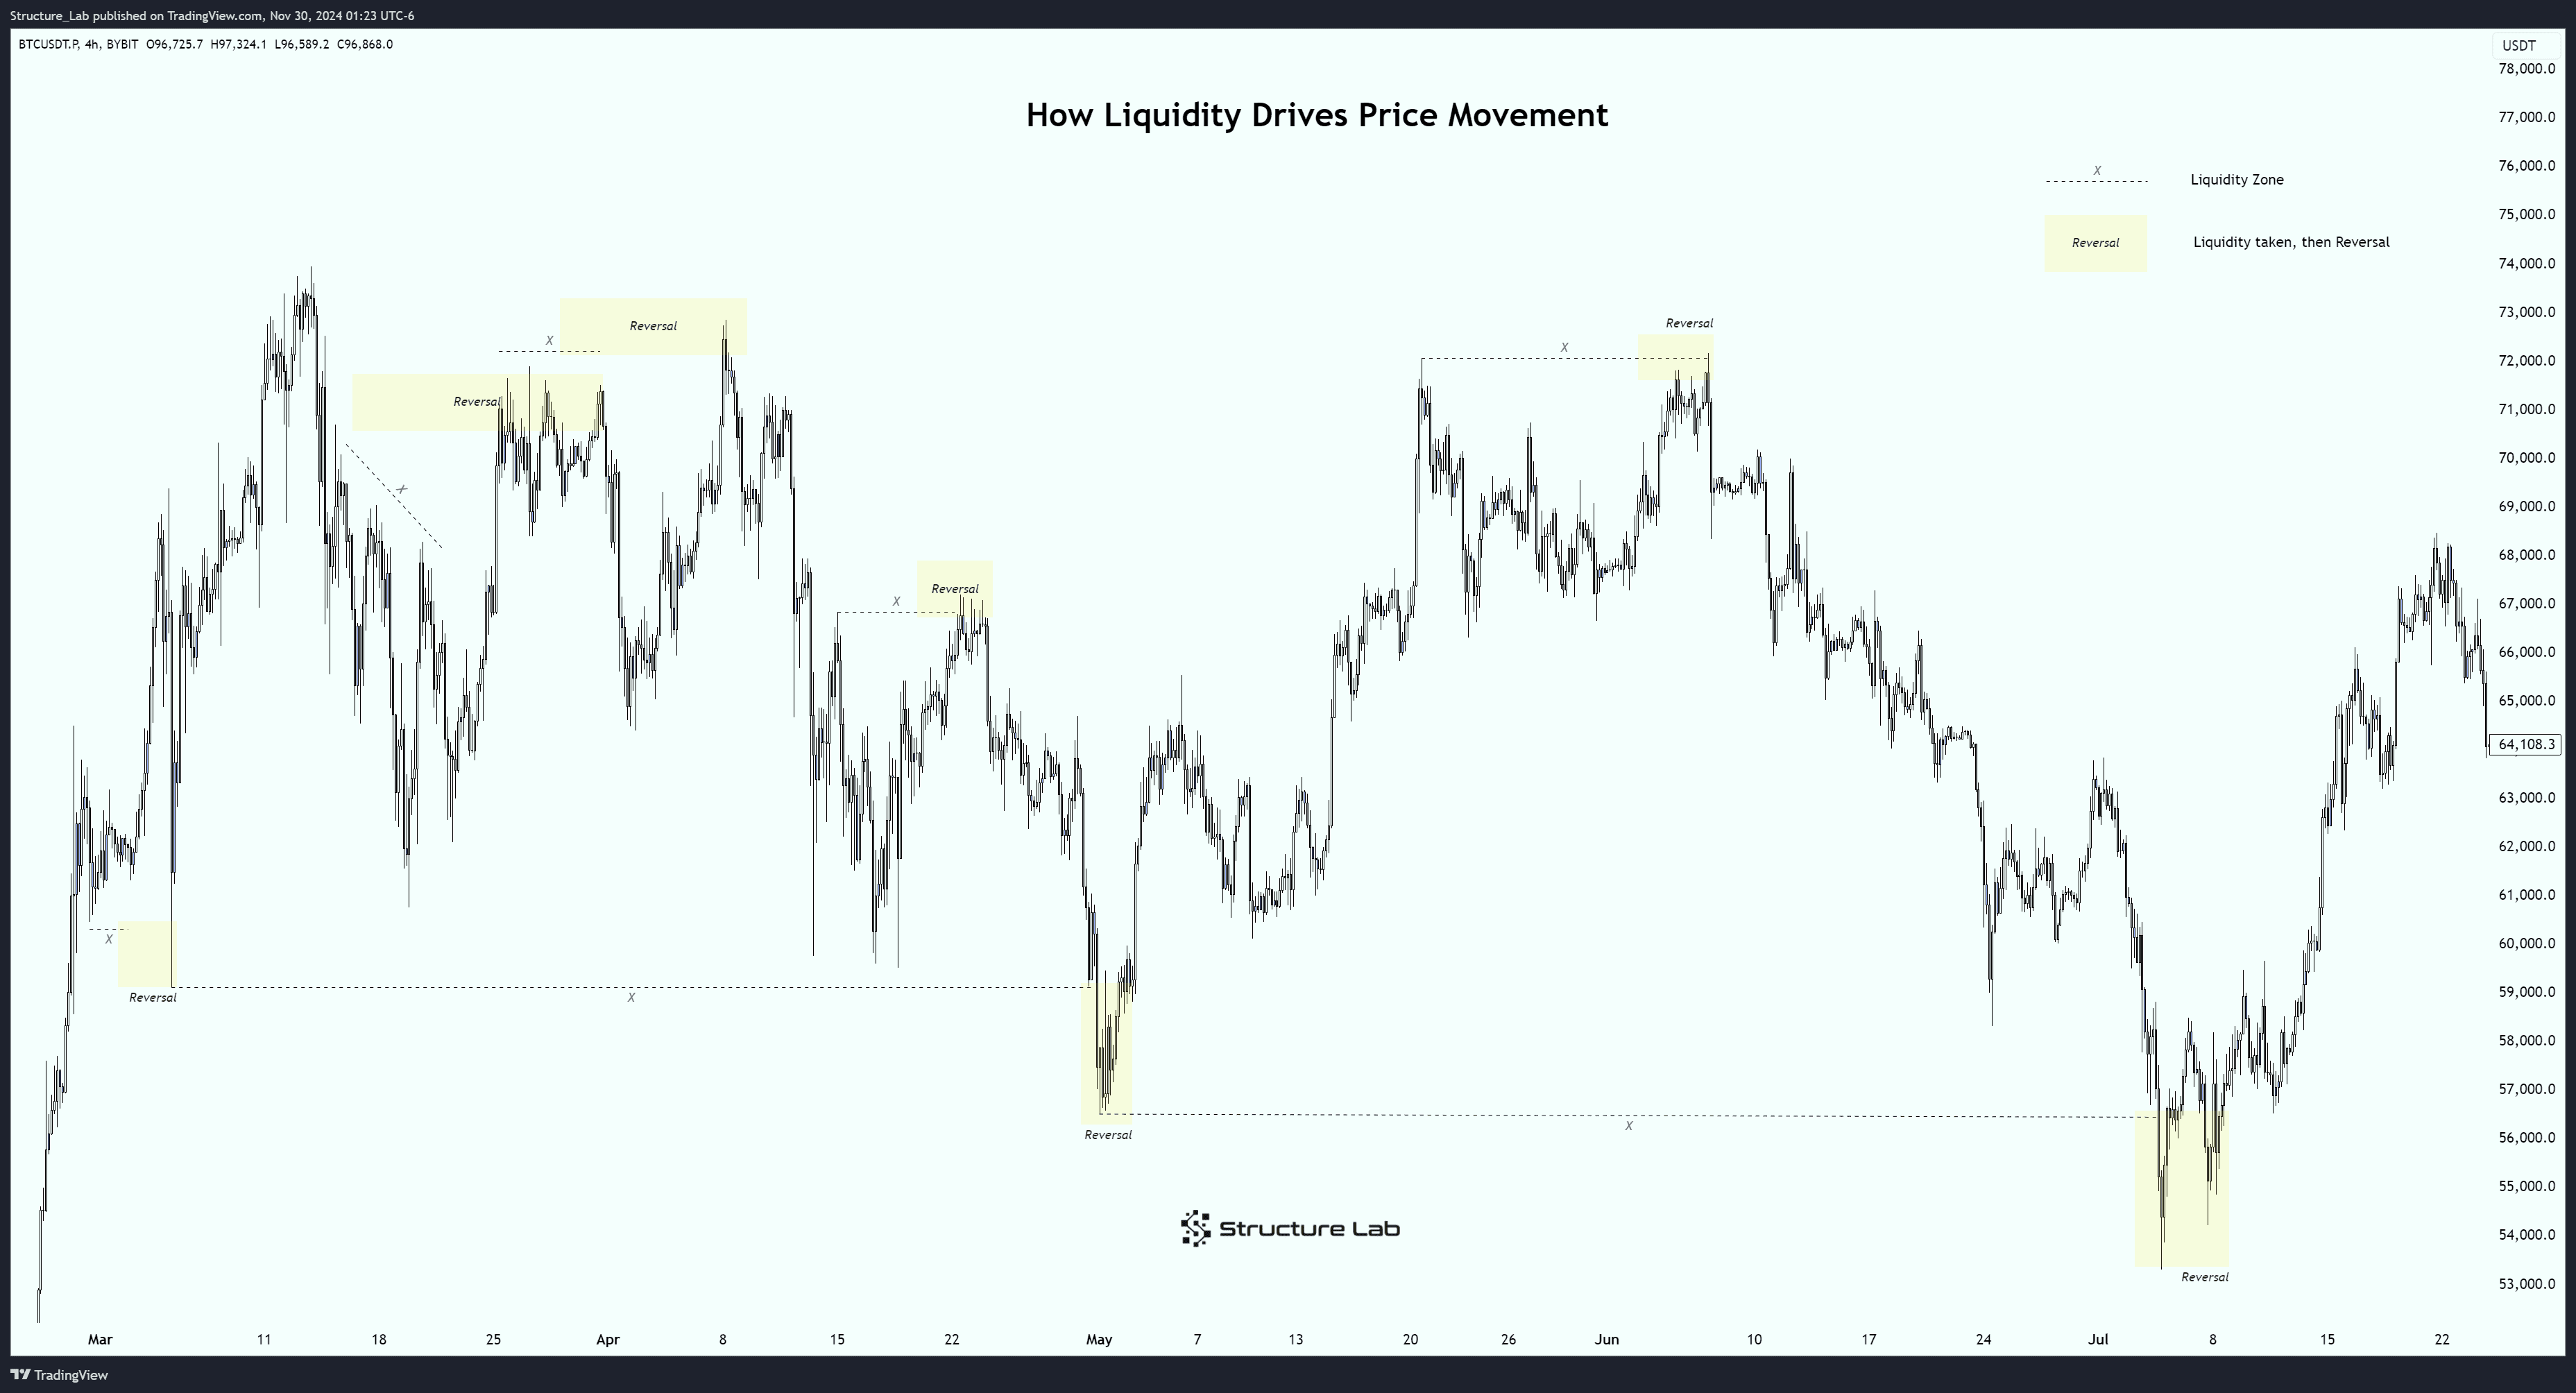
4. How Liquidity Drives Price Movement
Liquidity acts as a magnet, pulling price toward areas where significant orders are concentrated. Once these liquidity pools are tapped, they often spark significant price movements.
Triggering Stops and Orders:
For example, when price breaks a swing high, it triggers stop losses from short sellers and activates buy orders for breakout traders. This creates a burst of buy-side liquidity that propels price upward.
Large institutional players often rely on this burst of liquidity to execute their own sizable trades.
Sweeping Liquidity for Entry:
Institutions may deliberately push price into liquidity pools to create the volume they need.
For instance, price may be driven below a swing low, triggering stop losses (sell orders) that generate the liquidity necessary for institutions to take long positions.
https://s3.tradingview.com/snapshots/w/Wf9O9QQg.png
5. Practical Example of Liquidity in Action
Consider this scenario:
Price creates a new swing high and then pulls back.
Traders expecting the uptrend to continue place buy orders at the pullback with stop-loss orders below the recent swing low.
This setup creates a pool of sell-side liquidity below the low (from stop orders).
If institutions want to go long, they may push price down to trigger these stops, generating the liquidity they need to enter their trades.
This behavior forms predictable patterns:
Liquidity Sweeps: Price often moves just beyond key structural levels to tap liquidity before reversing.
Trend Continuation: In strong trends, liquidity is harvested repeatedly as price forms higher lows (uptrend) or lower highs (downtrend).
Major Reversals: Significant reversals often occur after large liquidity events at structural levels.
6. Quantifying Liquidity and Structure with Structure Lab
Structure Lab transforms the complexity of liquidity and market structure into actionable insights:
Liquidity Hotspots: Identifies areas where liquidity accumulates, such as swing highs, swing lows, and key structural levels.
Phases and Liquidity: Measures which structural phases are most likely to interact with liquidity.
Catalysts for Change: Quantifies how often liquidity events act as catalysts for the beginning or end of structural phases.
Event Analysis: Tracks distance, volume, and duration of price movements during liquidity sweeps.
Pattern Recognition: Highlights recurring interactions between liquidity events and structural changes.
7. Patterns and Predictions
By understanding how market structure and liquidity interact, traders can anticipate price behavior with greater accuracy:
Price Targets: Liquidity pools serve as magnets, guiding price toward these areas before reversing.
Behavioral Cues: Significant moves often occur after liquidity is tapped, signaling shifts in structure or trends.
Phases of the Market: Liquidity events may occur more frequently during certain phases of the market, such as pullbacks or breakouts, providing additional context for trading decisions.
8. Practical Trading Applications
Integrating liquidity and market structure into your analysis can help you:
Anticipate Price Moves: Predict where price will move based on liquidity accumulation.
Refine Entries and Exits: Identify high-probability trade locations where structure and liquidity align.
Understand Institutional Flow: Read price action through the lens of liquidity-driven moves by large players.
Manage Risk More Effectively: Account for likely liquidity sweeps to adjust stop-loss placements and avoid unnecessary losses.
Key Takeaway
Market structure and liquidity are inseparable. Market structure defines where liquidity accumulates, and liquidity drives price between these levels. Together, they create the patterns and behaviors that traders can anticipate and exploit.
With Structure Lab, you can quantify these interactions, transforming raw data into actionable insights. By measuring and analyzing liquidity events alongside market structure, Structure Lab equips you with the tools to identify high-probability trade opportunities and manage risk with precision. Understanding the dynamic relationship between structure and liquidity is your gateway to trading smarter and more effectively.

