Analysis
Timeframe Summary
Overview
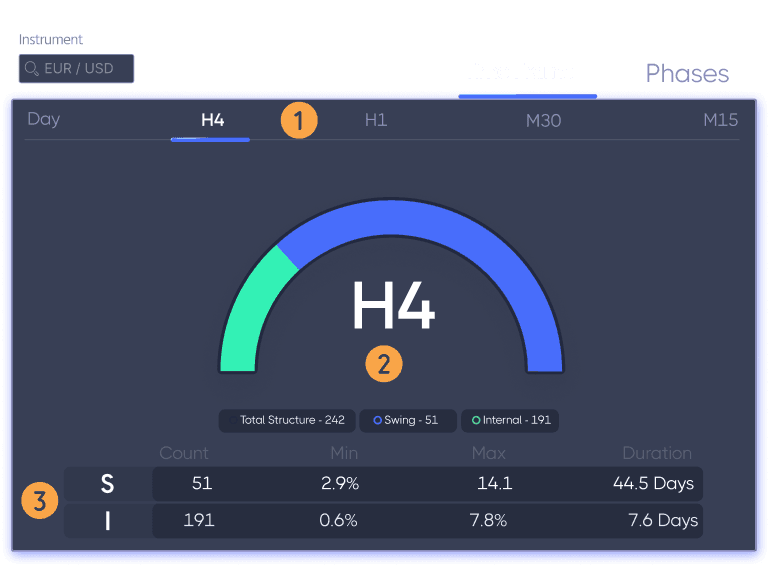
The Timeframe Summary section allows traders to select and view market structure data across multiple timeframes, including Daily, 4H, 1H, 30M, and 15M.
Key Features
Timeframe Selector
Users can switch between different timeframes to view market structure data relevant to their analysis.
Market Structure Composition (Chart)
Displays the proportion of Swing Structure vs. Internal Structure mapped for the selected timeframe.
Numerical Summary
Total Count: Number of structural points mapped.
Minimum % Distance: The smallest percentage move between structural points, setting a baseline for valid structure.
Maximum % Distance: The largest percentage move, helping define structure range.
Duration (Mean Value): Average time it takes for structure to form.
Practical Use
The minimum % distance helps traders set structure boundaries, ensuring that mapped structure is significant enough to be valid.
This data also helps traders configure structure parameters in the TradingView indicator for consistent analysis.
Join our Community Forum
Any other questions? Get in touch