Analysis
Structure Trends
Overview
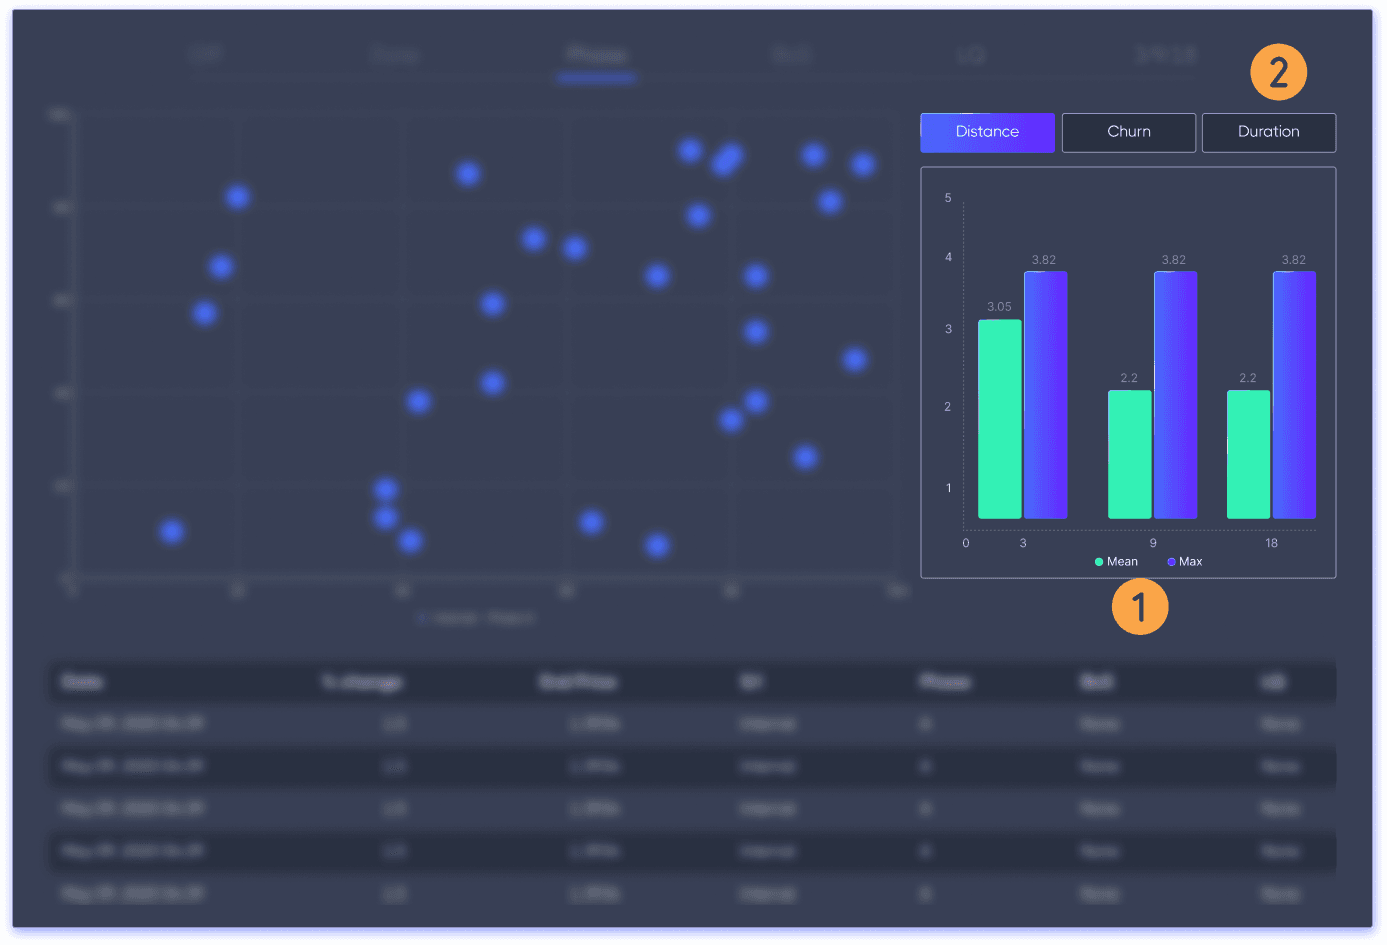
The Structure Trends section provides a vertical column graph displaying trends in three key structural metrics: Distance, Churn (Volume per % Change), and Duration. The graph presents mean and max values for the last 3, 9, and 18 data points, allowing traders to assess how structure is evolving over time.
Key Features
Vertical Column Graph for Clear Trend Visualization
Displays mean and max values for Distance, Churn, and Duration across the last 3, 9, and 18 data points.
Helps traders see how recent structural behavior compares to broader trends.
Stat Toggle Buttons
Users can toggle between Distance, Churn, and Duration to analyze different aspects of structural behavior.
Distance: Measures percentage change per structure, indicating how much price is moving.
Churn: Calculates volume required per % change, showing how efficiently price is moving.
Duration: Tracks how long structures take to complete, providing insight into market pacing.
Practical Use
Identifies Recent Market Behavior Trends – Comparing short-term (3 structures) vs. medium-term and long-term (9 and 18 structures) helps track changes in momentum, volume participation, and speed of movement.
Highlights Structural Consistency or Volatility – If max values fluctuate significantly while means remain stable, this may suggest occasional volatility rather than a persistent trend shift.
Provides Context for Trade Planning – Understanding whether distance, churn, or duration is increasing or decreasing can help traders align their strategies with current market conditions.
By toggling between Distance, Churn, and Duration, traders gain a dynamic, data-driven view of market structure evolution, allowing for more informed and objective decision-making.
Join our Community Forum
Any other questions? Get in touch