Analysis
Phase Profiles
Overview
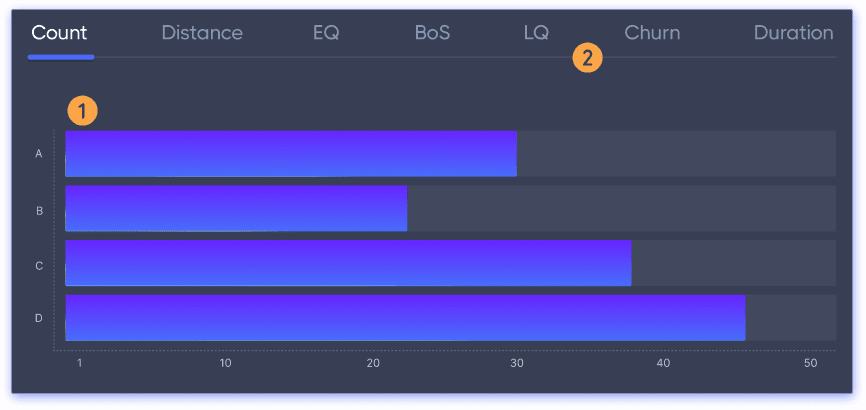
The Phase Summary section provides traders with a structured analysis of market structure behavior across four different phases (A, B, C, D). Traders can visualize how structure behaves within each phase, while a slider selector allows for deeper analysis of key metrics.
Key Features
Stacked Column Graph
Displays the distribution of market structure phases.
Allows for a quick visual comparison of how often each phase occurs.
Slider Selector Metrics
Count – Number of structures tagged with each phase.
Distance – Mean price movement percentage for structures in each phase.
EQ (Equilibrium Mitigation) – Percentage of structures that mitigated the EQ level of the prior leg.
BoS (Break of Structure) – Percentage of structures in each phase that resulted in a break of structure.
LQ (Liquidity Interaction) – Percentage of structures that swept liquidity or interacted with liquidity at their starting point.
Churn (Volume Efficiency Ratio) – Measures how much volume was required for each 1% price movement.
Helps traders identify low-volume moves, which can indicate potential reversals or weak trends.
Duration – Mean time taken for structures within each phase to complete.
Trading Benefits
Defines Behavioral Differences Across Phases – Traders can identify how price typically moves in each phase.
Reveals Structural Tendencies – Highlights which phases are more likely to result in breaks of structure (BoS) or liquidity interactions (LQ).
Optimizes Trade Planning – Helps traders understand how long structures within each phase typically take to complete (Duration metric).
Identifies Potential Reversal Zones – Churn values show whether price moves with high or low participation, aiding in spotting weak trends.
Enhances Liquidity-Based Trading – Shows the probability of liquidity sweeps and equilibrium mitigation, helping refine entry and exit points.
Practical Use
Helps traders choose structure phases that align with their strategy based on historical data.
Assists in risk management, as different phases may have different probabilities of breaking structure or sweeping liquidity.
Improves timing of trade entries and exits by analyzing phase duration trends.
Provides objective data for adjusting stop-loss and take-profit levels based on price behavior within each phase.
This section offers quantifiable insights into market structure behavior, helping traders refine their decision-making and set realistic expectations for price movement within each phase.
Join our Community Forum
Any other questions? Get in touch