Analysis
Timing
Overview
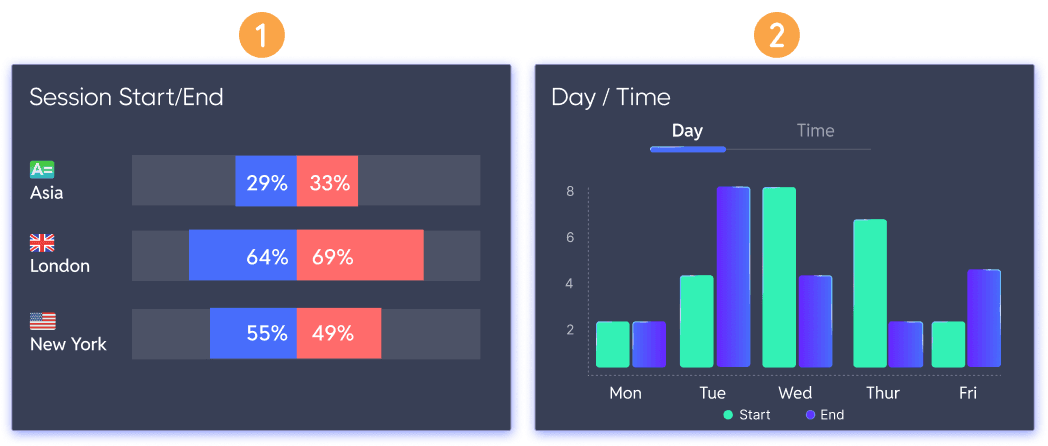
The Timing section provides insight into when market structure forms and completes by displaying two key visualizations:
Session Start/End – Shows the percentage of selected structures that started and ended during each of the three major trading sessions:
Asia
London
New York
Time of Completion – Displays when structures completed, broken down by:
Days of the Week
Hours of the Day
These graphs help traders identify time-based patterns in structural behavior.
Key Features
Session Start/End Graph
Breaks down structural occurrences by trading session.
Shows how many selected structures began and ended during Asia, London, or New York sessions.
Time of Completion Graph
Displays the distribution of structure completions by day of the week and hour of the day.
Helps highlight time-based patterns in market structure behavior.
Why This Data is Meaningful for Traders
Identifies When Structural Movements Are Most Likely to Begin and End
If a high percentage of structures start and end during specific sessions, traders can align their focus with those sessions.
Helps traders understand which sessions contribute most to market structure formation and completion.
Highlights Potential Timing Patterns for Entry & Exit Optimization
If a majority of structures complete at a specific time of day, traders may refine their execution timing.
Identifying which trading sessions or hours produce the most structure changes can help traders avoid low-probability times.
Avoids Trading During Inefficient Market Hours
If data shows that structure rarely forms or completes during certain times (e.g., late U.S. session or pre-Asia), traders can avoid low activity periods.
Helps prevent unnecessary exposure during low-liquidity conditions when price movement is less reliable.
Supports Time-Based Strategy Refinement
Some traders rely on session-based strategies—this data provides an objective, statistical basis for optimizing their approach.
Helps confirm whether a trader’s existing execution timing aligns with historical structure behavior.
Practical Use
Focus trading during sessions with the highest structural completion rates.
Refine trade timing by understanding which hours or days see the most structure completions.
Avoid trading low-probability hours, reducing exposure to poor market conditions.
By providing objective timing data, this section helps traders improve trade execution efficiency and overall market awareness.
Join our Community Forum
Any other questions? Get in touch