


2- Getting Started
nerd candy
Market Structure is The Collective Behavior of Market Participants - a simple equation:
Think of market structure like a traffic pattern. When you watch traffic from above, you can see clear patterns emerge - morning rush hour, lunch time congestion, evening slowdown. These patterns aren't random - they're the collective result of thousands of people making decisions about when and where to drive.
Markets work the same way. What we call "market structure" - the highs, lows, and trends we see on charts - is actually just the visible result of all traders' collective behavior. And just like traffic patterns, this behavior tends to follow predictable phases.
The equation MS = Σ(P[A,B,C,D]) mathematically describes these behavior phases. Each phase represents a different way traders are interacting with price:
Phase A shows aligned behavior - like smooth-flowing traffic where everyone's moving in the same direction.
Phase B and C show partial misalignment - like merging traffic where some cars are changing lanes.
Phase D shows complete misalignment - like gridlock where cars are stuck trying to move in opposing directions.
Why does this matter? Because if we can measure and quantify these behavior patterns, we can predict with probability where price is likely to go next. It's like having a traffic forecast that helps you know the best time to start your journey.
This is what Structure Lab does - it measures the key variables in each phase (distance, time, volume, etc.) to help traders anticipate structural shifts before they happen. Instead of guessing, traders can make decisions based on proven behavioral patterns.
The Market Structure Equation:
To model market structure as the collective behavior of market participants, we can develop an equation that incorporates the four distinct phases (A, B, C, D) and the key variables of each phase: distance, duration, churn, and liquidity interaction.
Variables and Definitions
Distance (D): The percentage change in price measured from low to high or high to low in any given phase.
Duration (T): The time it takes for price to move from low to high or high to low in any given phase.
Churn (C): The amount of volume (effort) divided by the percentage change, indicating the volume required for every 1% price change.
Liquidity Interaction (L): A measure of whether new market structure begins or ends with price interacting with a liquidity pool, often just beyond recent highs and lows. This reflects the price reaching areas where liquidity is concentrated, which can lead to reversals or the initiation of new trends.
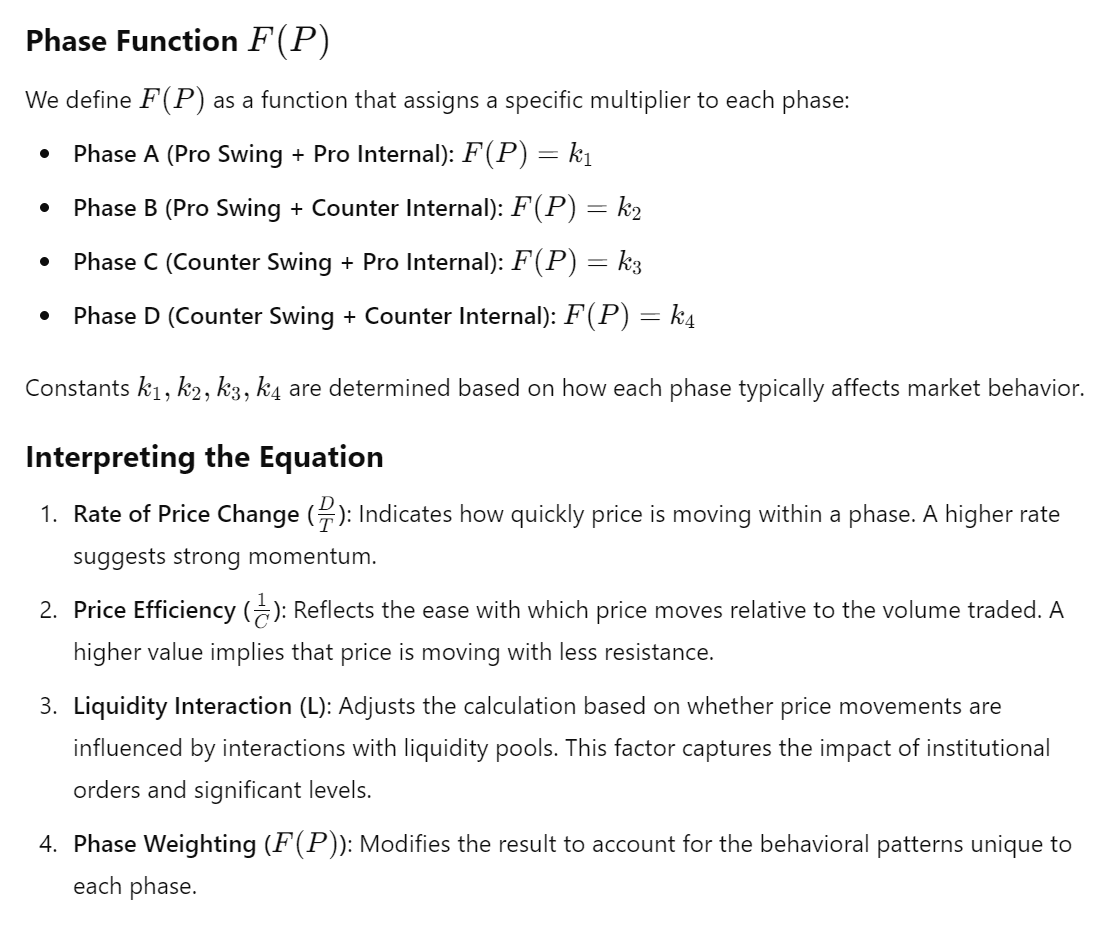
Phase (P): One of the four distinct market phases:
Phase A: Pro Swing + Pro Internal
Phase B: Pro Swing + Counter Internal
Phase C: Counter Swing + Pro Internal
Phase D: Counter Swing + Counter Internal
Equation for Market Structure
Market structure can be represented by the following equation:

Understanding Liquidity Interaction (L)
Liquidity Interaction (L) measures the influence of price interacting with liquidity pools:
When L > 1: Indicates that price has interacted with a significant liquidity pool, often leading to the start or end of a market structure (e.g., a trend reversal after reaching a liquidity pool beyond a recent high).
When L = 1: Neutral interaction; price movement isn't significantly influenced by liquidity pools.
When L < 1: Suggests minimal interaction with liquidity pools, indicating that the current market structure may persist without major changes.
Predicting Market Participant Behavior
By solving the equation for Market Structure (MS), we can predict the collective behavior of market participants in different phases.
Example Calculation:
Suppose we have the following data for Phase A:
Distance (D): 6% price increase
Duration (T): 3 days
Churn (C): 150,000 units of volume per 1% change
Liquidity Interaction (L): 1.2 (since price began a new structure after interacting with a liquidity pool beyond a recent high)
Phase A Multiplier (k1): 1.5
Plugging in the values:
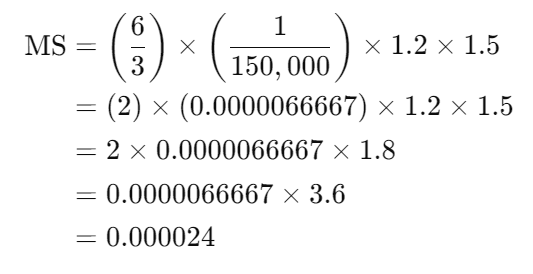
This result quantifies the market structure for Phase A under the given conditions.
Using the Equation for Prediction
By comparing the calculated Market Structure (MS) values across different phases and conditions, analysts can:
Identify Trends: Determine which phases are leading to stronger or weaker market structures.
Anticipate Movements: Predict potential price movements based on changes in the key variables.
Assess Participation: Understand the collective behavior of market participants in terms of effort and efficiency.
Final Answer
An equation to describe market structure as the collective behavior of market participants is:
Where:
Distance (D): Percentage price change in a phase.
Duration (T): Time taken for the price change.
Churn (C): Volume divided by percentage change.
Liquidity Interaction (L): A measure of whether new market structure begins or ends with price interacting with a liquidity pool, often just beyond recent highs and lows.
F(P): A function assigning a multiplier based on the phase (A, B, C, D).
This equation incorporates the four key variables and adjusts for the specific market phase, allowing for the prediction of participant behavior based on quantifiable factors.
📌 You don't have to understand any of this to make money. This is just how nerds flex.

